Accuracy and Scoring Report
Table of Contents
- Overview
- Dropdowns
- Caculations
- Tables
- Stored Procedures
Overview
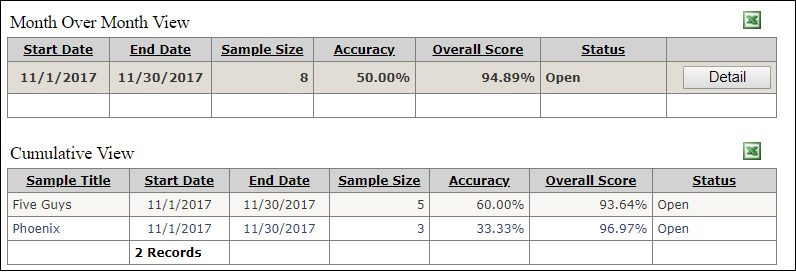
Accuracy & Scoring Report shows the sample size, accuracy, and overall scores. Report can filter by selecting dropdowns, and export data to excel spreadsheet.
Dropdowns
Dropdowns help narrow down the report to specific Quality Area, Business Area, Audit Type, and Lead users. Date Month ranges are required. Report can show Month to Month or Cumulative View.
- See [Calculations]
- See [Image Dropdowns]
Calculations
Month Over Month View
Accuracy = (SUM(PointsLost = 0) / SampleSize) * 100
Overall Score = SUM(PointsEarned) / SUM(PointsPossible)
Cumulative View
Accuracy = (SUM(PointsLost = 0) / SampleSize) * 100
Overall Score = SUM(PointsEarned) / SUM(PointsPossible)
Tables
smart.p10_AuditInstance
smart.p10_Question
smart.p10_qry_InstanceHeader
Stored Procedures
smart.p10_Report_AccuracyScoring
Image Dropdowns
Back to [Dropdowns]

Image Calculations
Back to [Calculations]