Benefit Results Report
Table of Contents
Overview
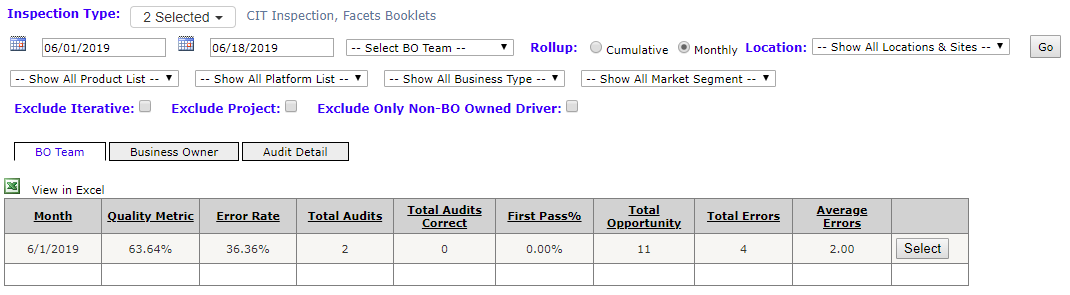
Benefit Result Report pulls all audits or can be narrowed down by drop downs, shows overall calculations, and these calculations are based on BO Team, Business Owner, and audit detail. The condition to see data from this report is when the Audit is closed.
Images 1: Shows a benefit results report in cumulative view
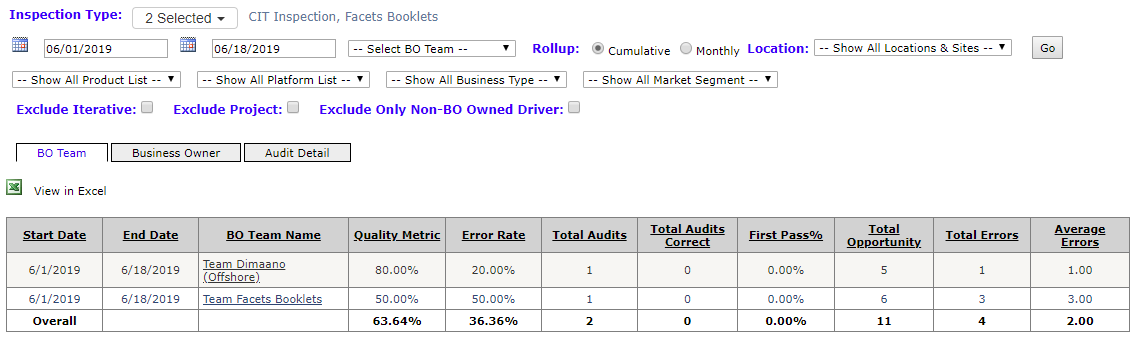
Image 2: Shows a benefit results report in a monthly view
Dropdown Checkbox List
Multiple inspection types can be selected from the Dropdown Checkbox List.
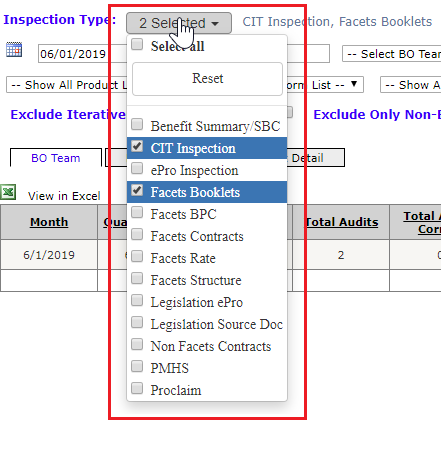
- Business Type: (or Inspection Type) CIT, ePro, Benefit/SBC, Facets, Non Facets
Drop Downs
User can narrow down the report by using drop down filters.
- Month Range: From Month, Year - To Month, Year
- Effective Date
- Business Owner Team
- Monthly/YTD
- Location: On Site, Off Site, GSP
Calculations
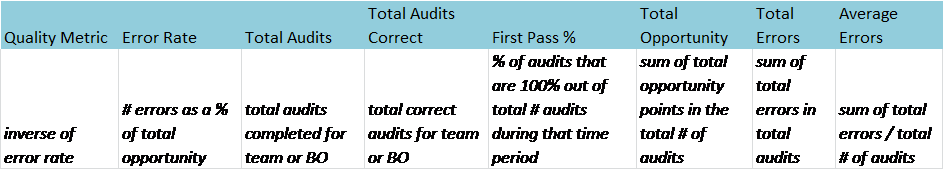
- Quality Metric = 1 - (ErrorPoint / OpportunityPoint) Definition
- Error Rate = ErrorPoint / OpportunityPoint
- Total Audits
- Total Audits Correct
- First Pass % = TotalAuditsCorrect / Total Audits
- Total Opportunity
- Total Errors
- Average Errors = Total Errors / Total Audits
Tables and Views
smart.p11_qry_IntakeForm_short
- [DateClosed] used to filter all audits in closed state and From, To Month dropdowns
- [TransactionEffectiveDate] determines if audit shows in report
smart.p11_Team
- smart.p11_CodeList
Stored Procedures
- smart.p11_Report_BenefitResult